Meltdown & Spectre Performance Impact at Stack Overflow
January 15, 2018
Announced early in the year, Meltdown and Spectre processor vulnerabilities affect nearly all servers and consumer PCs. As of now, attacks are only proof-of-concept, and no known exploits are in the wild. At Stack Overflow, we’ve done some testing on the impact of software mitigations designed to protect against these vulnerabilities. Software patches are available for Meltdown and currently known exploit vectors of Spectre, and we’ll take a look at their impact on system performance below. If you’re already familiar with the vulnerabilities and how to patch them, jump down to the Impact Section.
Two of the interesting things about this particular set of vulnerabilities are that 1) there’s a significant performance hit to enable mitigations for them and 2) it’s been very difficult for hardware and software vendors to prepare and deploy mitigations. While the details of these vulnerabilites have only been public since early 2018, Google’s Project Zero initiative discovered them in July 2017, allowing core software vendors six months to prepare mitigations. Mitigation of the vulnerabilities also require both processor microcode update (BIOS) and an operating system patch.
For details about our patch processes against the vulnerabilies, see this page.
Overview of Vulnerabilities
Meltdown
Meltdown is a hardware-level vulnerability that allows userspace programs to access protected kernel memory affecting all modern Intel processors and some ARM processors. Operating systems mitigate this vulnerability via software level memory isolation protections, and patches are available for MacOS, Windows, and most Linux distributions now.
Spectre
In a very simplified explanation: in order to boost performance, most modern processors take in multiple instructions at a time from the operating system. Assumptions can be exploited, and protected data can be leaked from vulnerable systems. This is the Spectre vulnerability, which derives its name from Speculative Execution. If you want to learn more about how branch prediction works, Dan Luu has an excellent, much more in-depth explaination of how branch prediction works here. Spectre is much more complicated both in exploitation and patch creation.
Impact
To say performance hits were noticeable on our servers would be an understatement. This is evident in both server performance metrics and service load times. I’ll break down details of our performance hits during our first steps of canary testing below.
For all of the graphs below, the timeframe is a one hour sampling from early afternoon traffic (17:30UTC - 18:30UTC) against the servers after the patch compared to the same time period one day earlier. To keep graphs consistent, all metrics prior to patching are shown in green and all metrics after patching in yellow.
Because of the amount of traffic that we get continuously to our websites, there’s always non-trivial load against our servers. When evaluating the performance impact of the patches, I didn’t do any synthetic benchmarks. While synthetic benchmarks can be good to get an understanding of the baseline performance of a system, having real-world performance impact is much more valuable.
Server Resource Utilization
Server performance impact was immediately visible after patching our test servers. The most affected and most apparent resource on our patched servers is the CPU. Increasing load on the CPU, however, can also increase context switching and waits for other resources–such as network and disk.
Web Server
This is a bare metal Windows 2012 R2 server running on Dell R630 (13th generation) rack-mount hardware.
To make sure that this is a fair comparison, let’s also take a look at the number of requests being serviced by the web tier. While this is feeding active public traffic, our load patterns are consistent over time so there is little variance caused by workload changes.
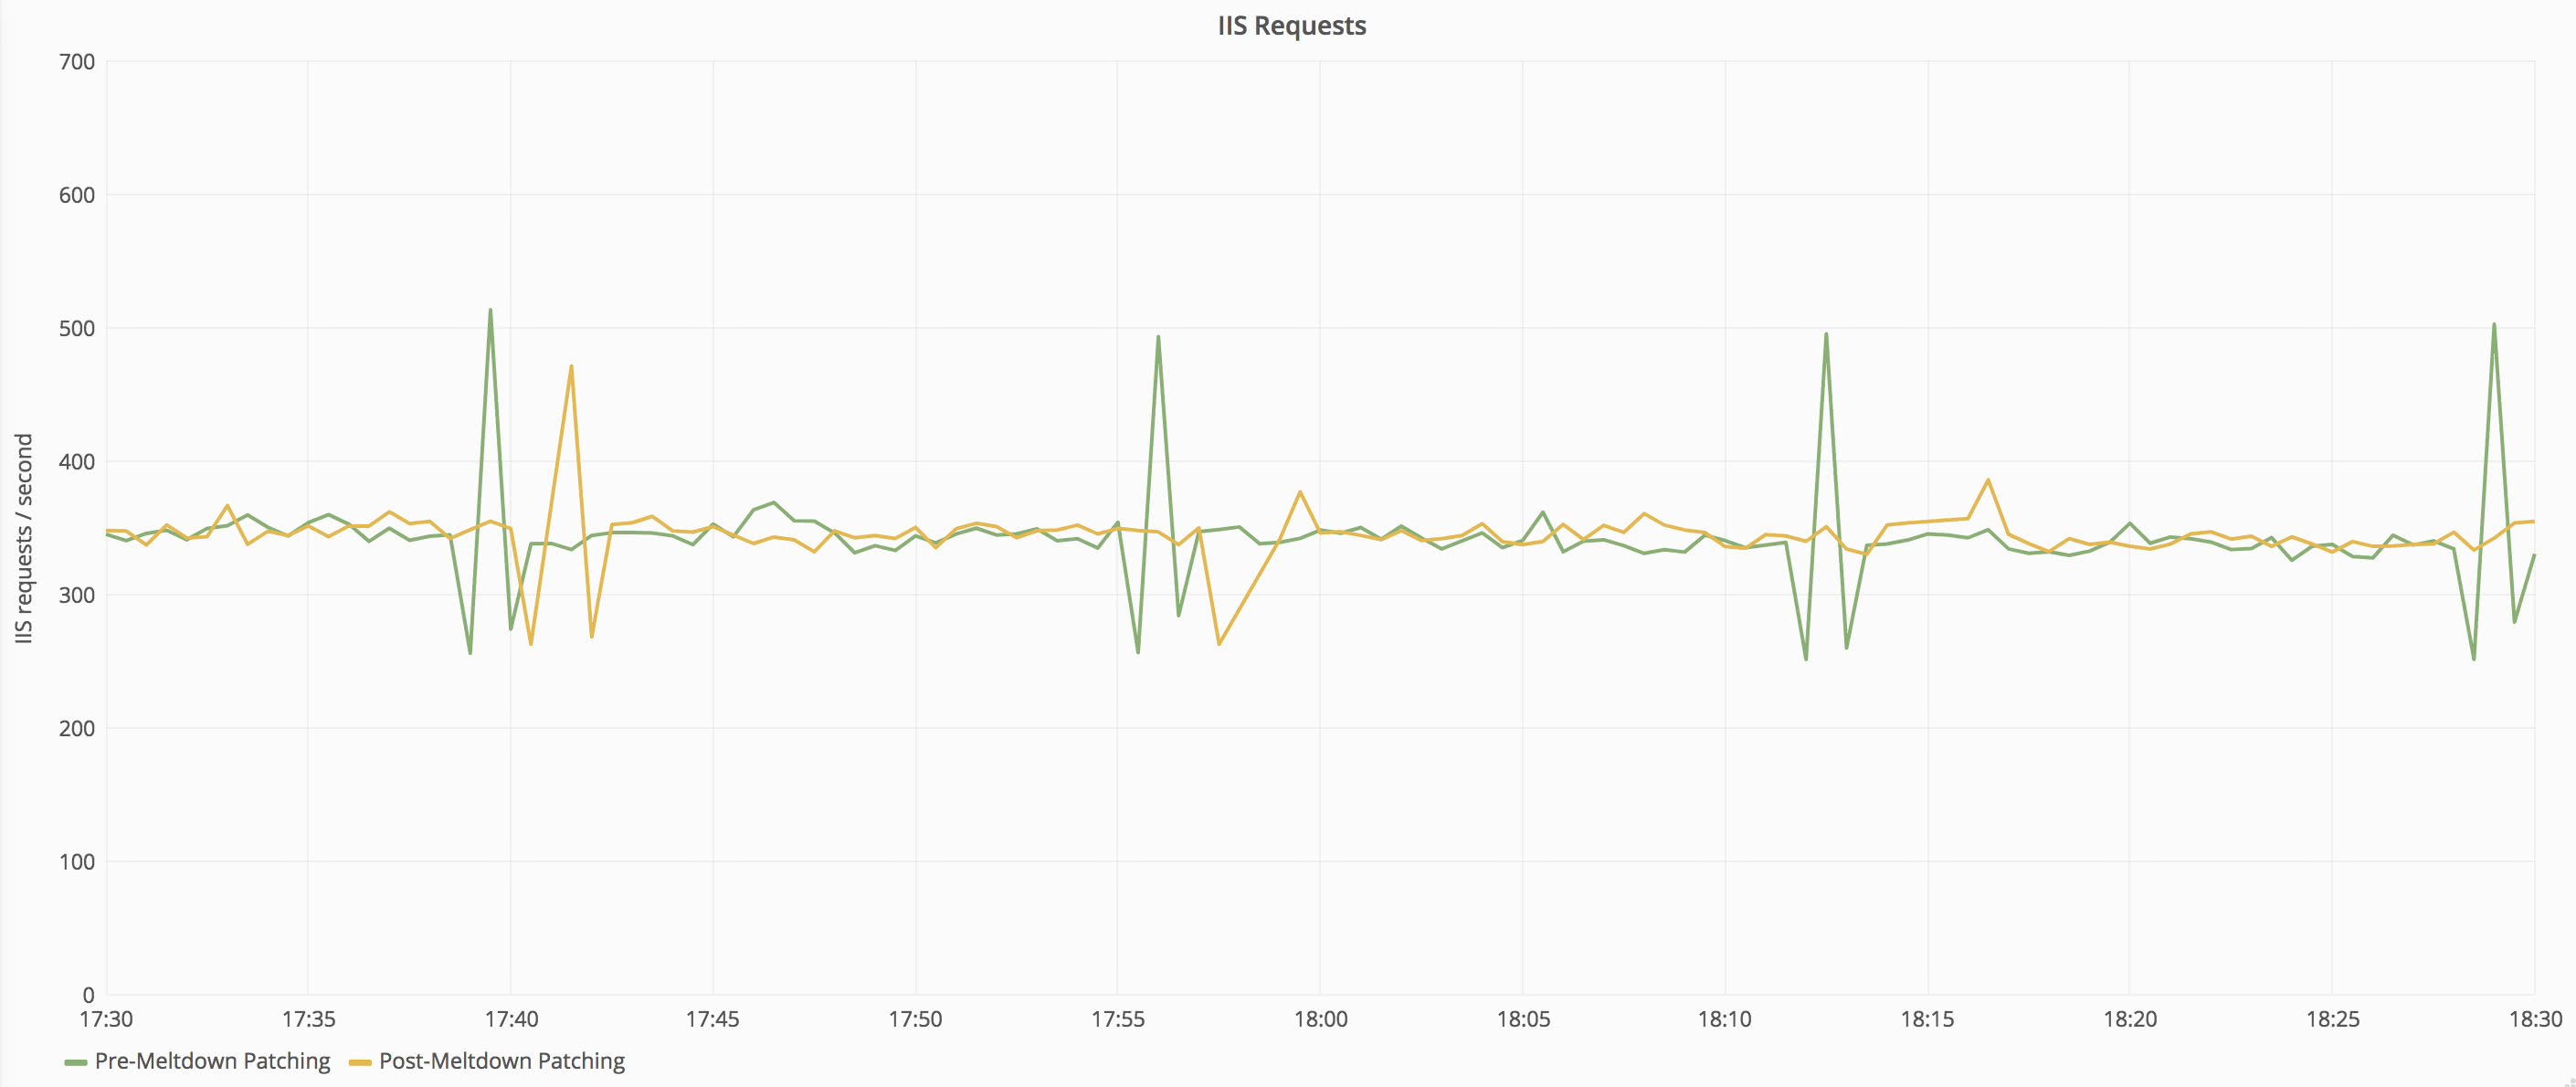
Request loads are very close between the two time periods–within 1% of each other–so we can continue with our metric comparison. Let’s take a look at CPU first. The graph below shows the CPU on one of our front-end web servers before and after the patch.
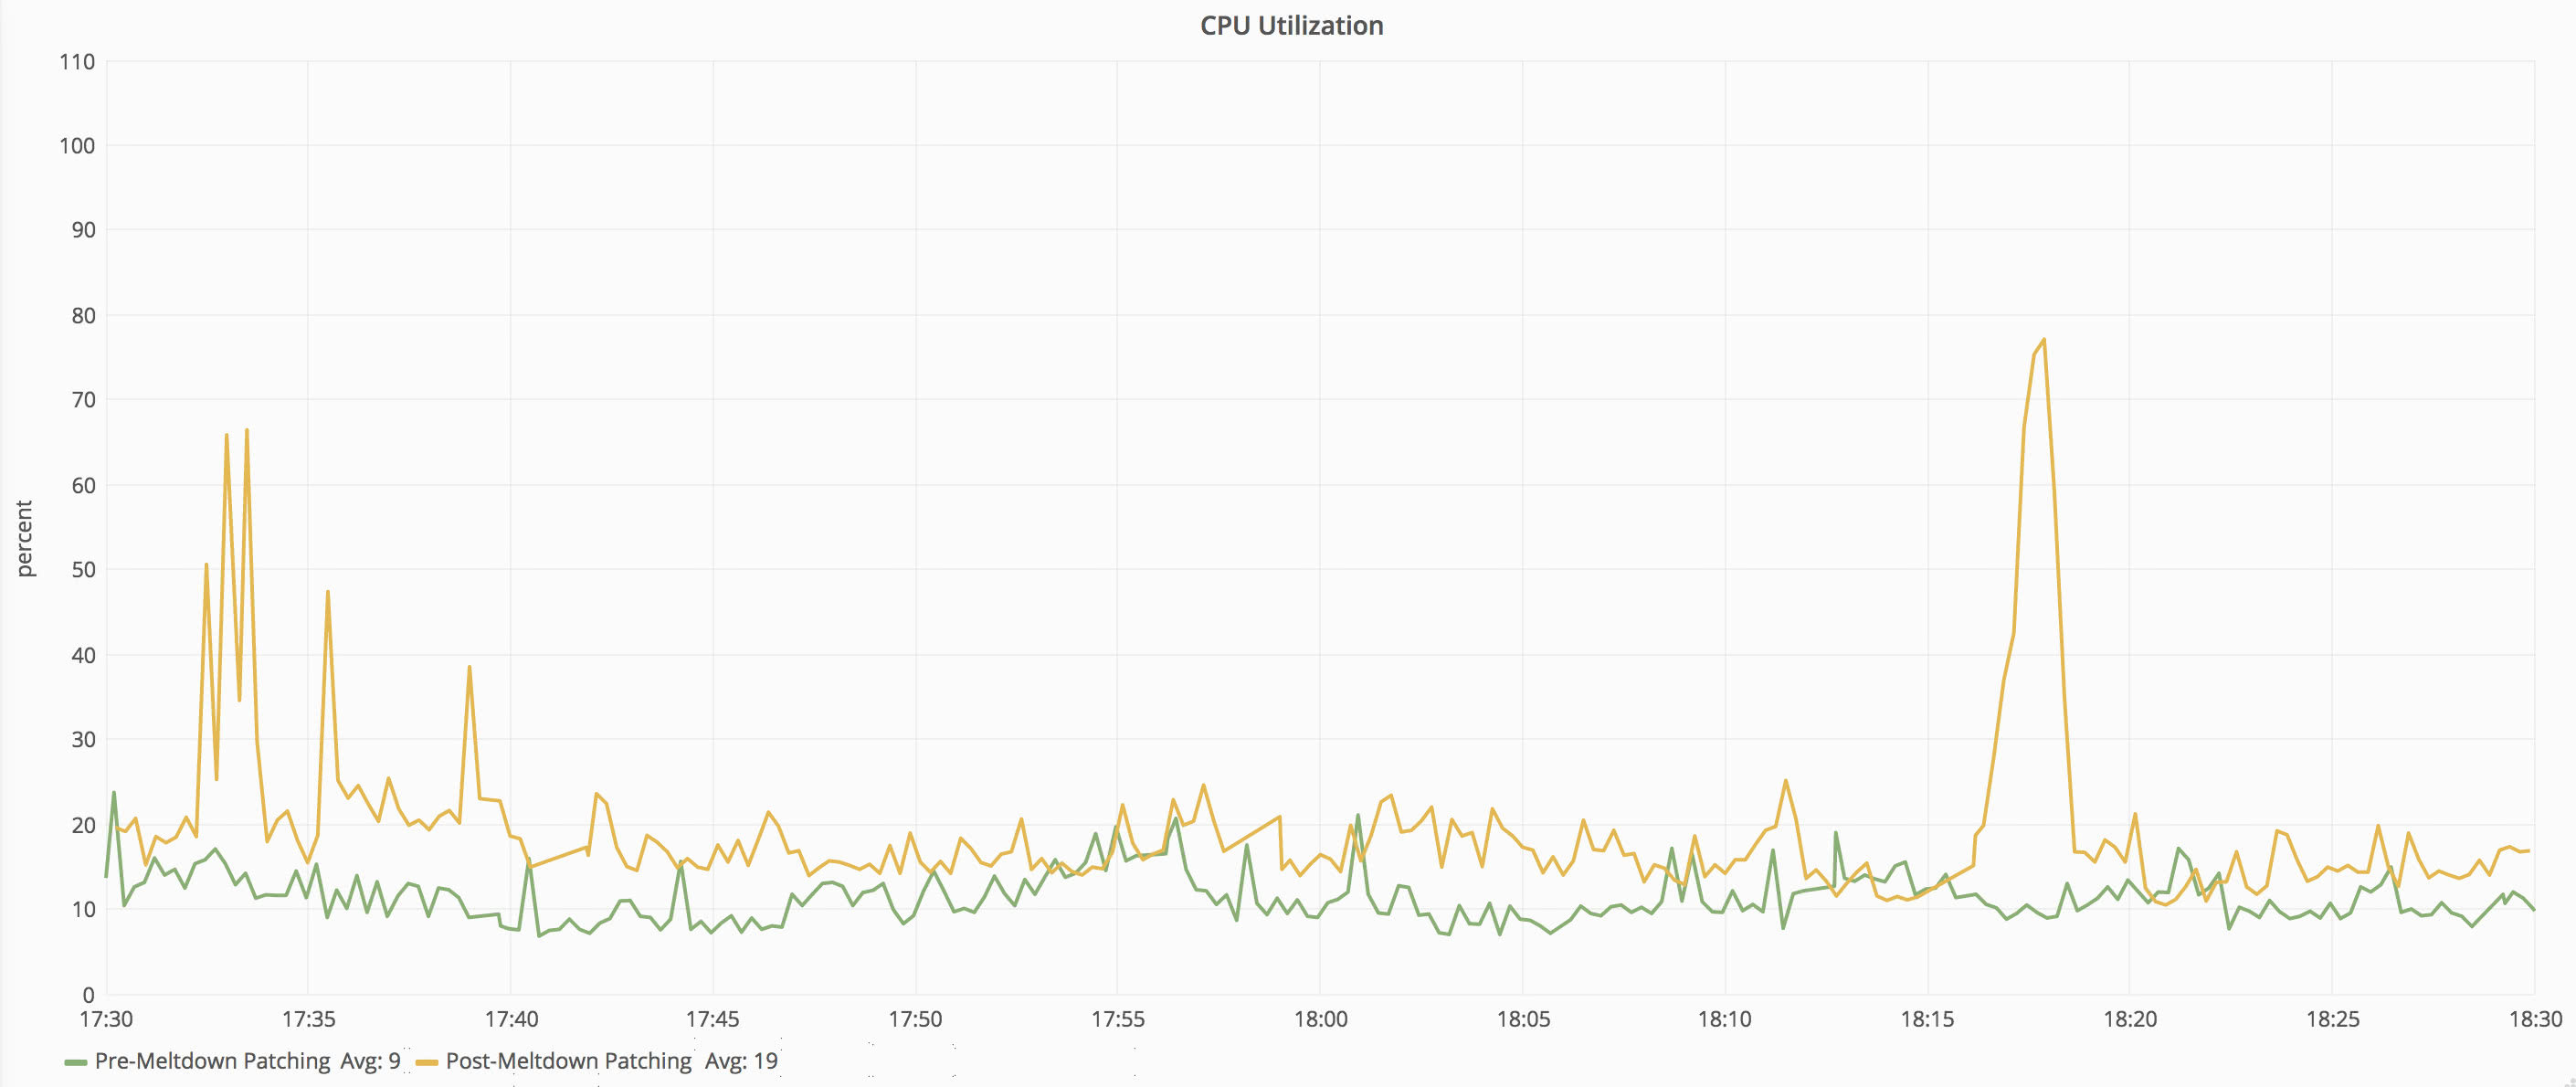
We can see that there is a significant jump in CPU active time after applying the patch. The CPU utilization increased from 9% average to 19% average–an increase of 111% utilization across that window. The maximum CPU percentage increased even more significantly from 24% to 66%–an increase of 175%.
Utilization percentage doesn’t tell the whole story, so let’s take a look at the CPU queue length and context switches:
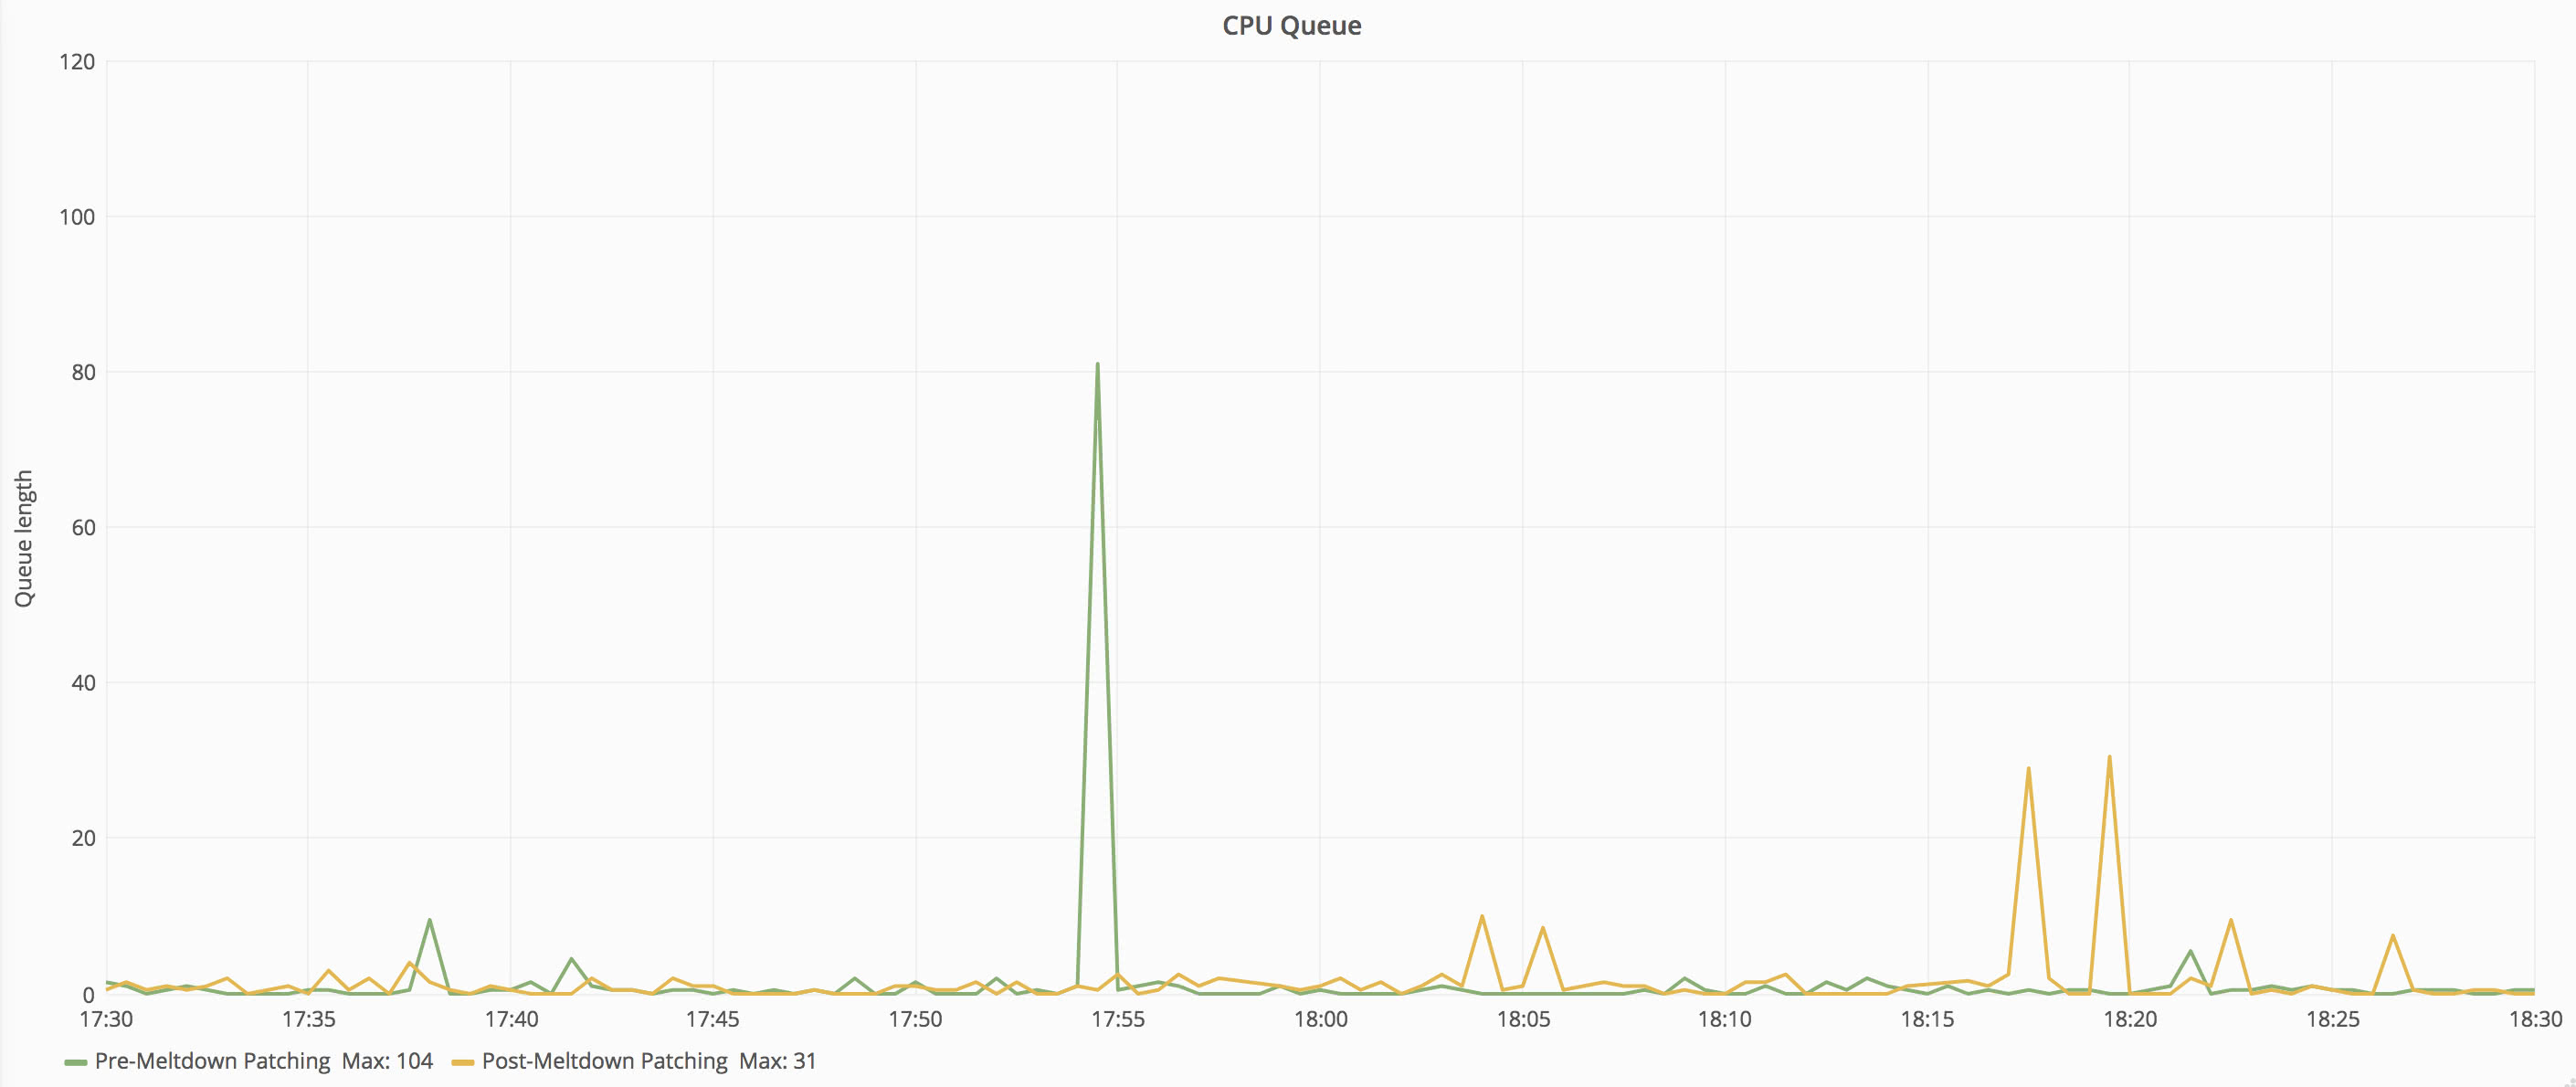
Post patch, CPU queue spikes occurred more frequently, but the overall impact of those spikes is still fairly low.
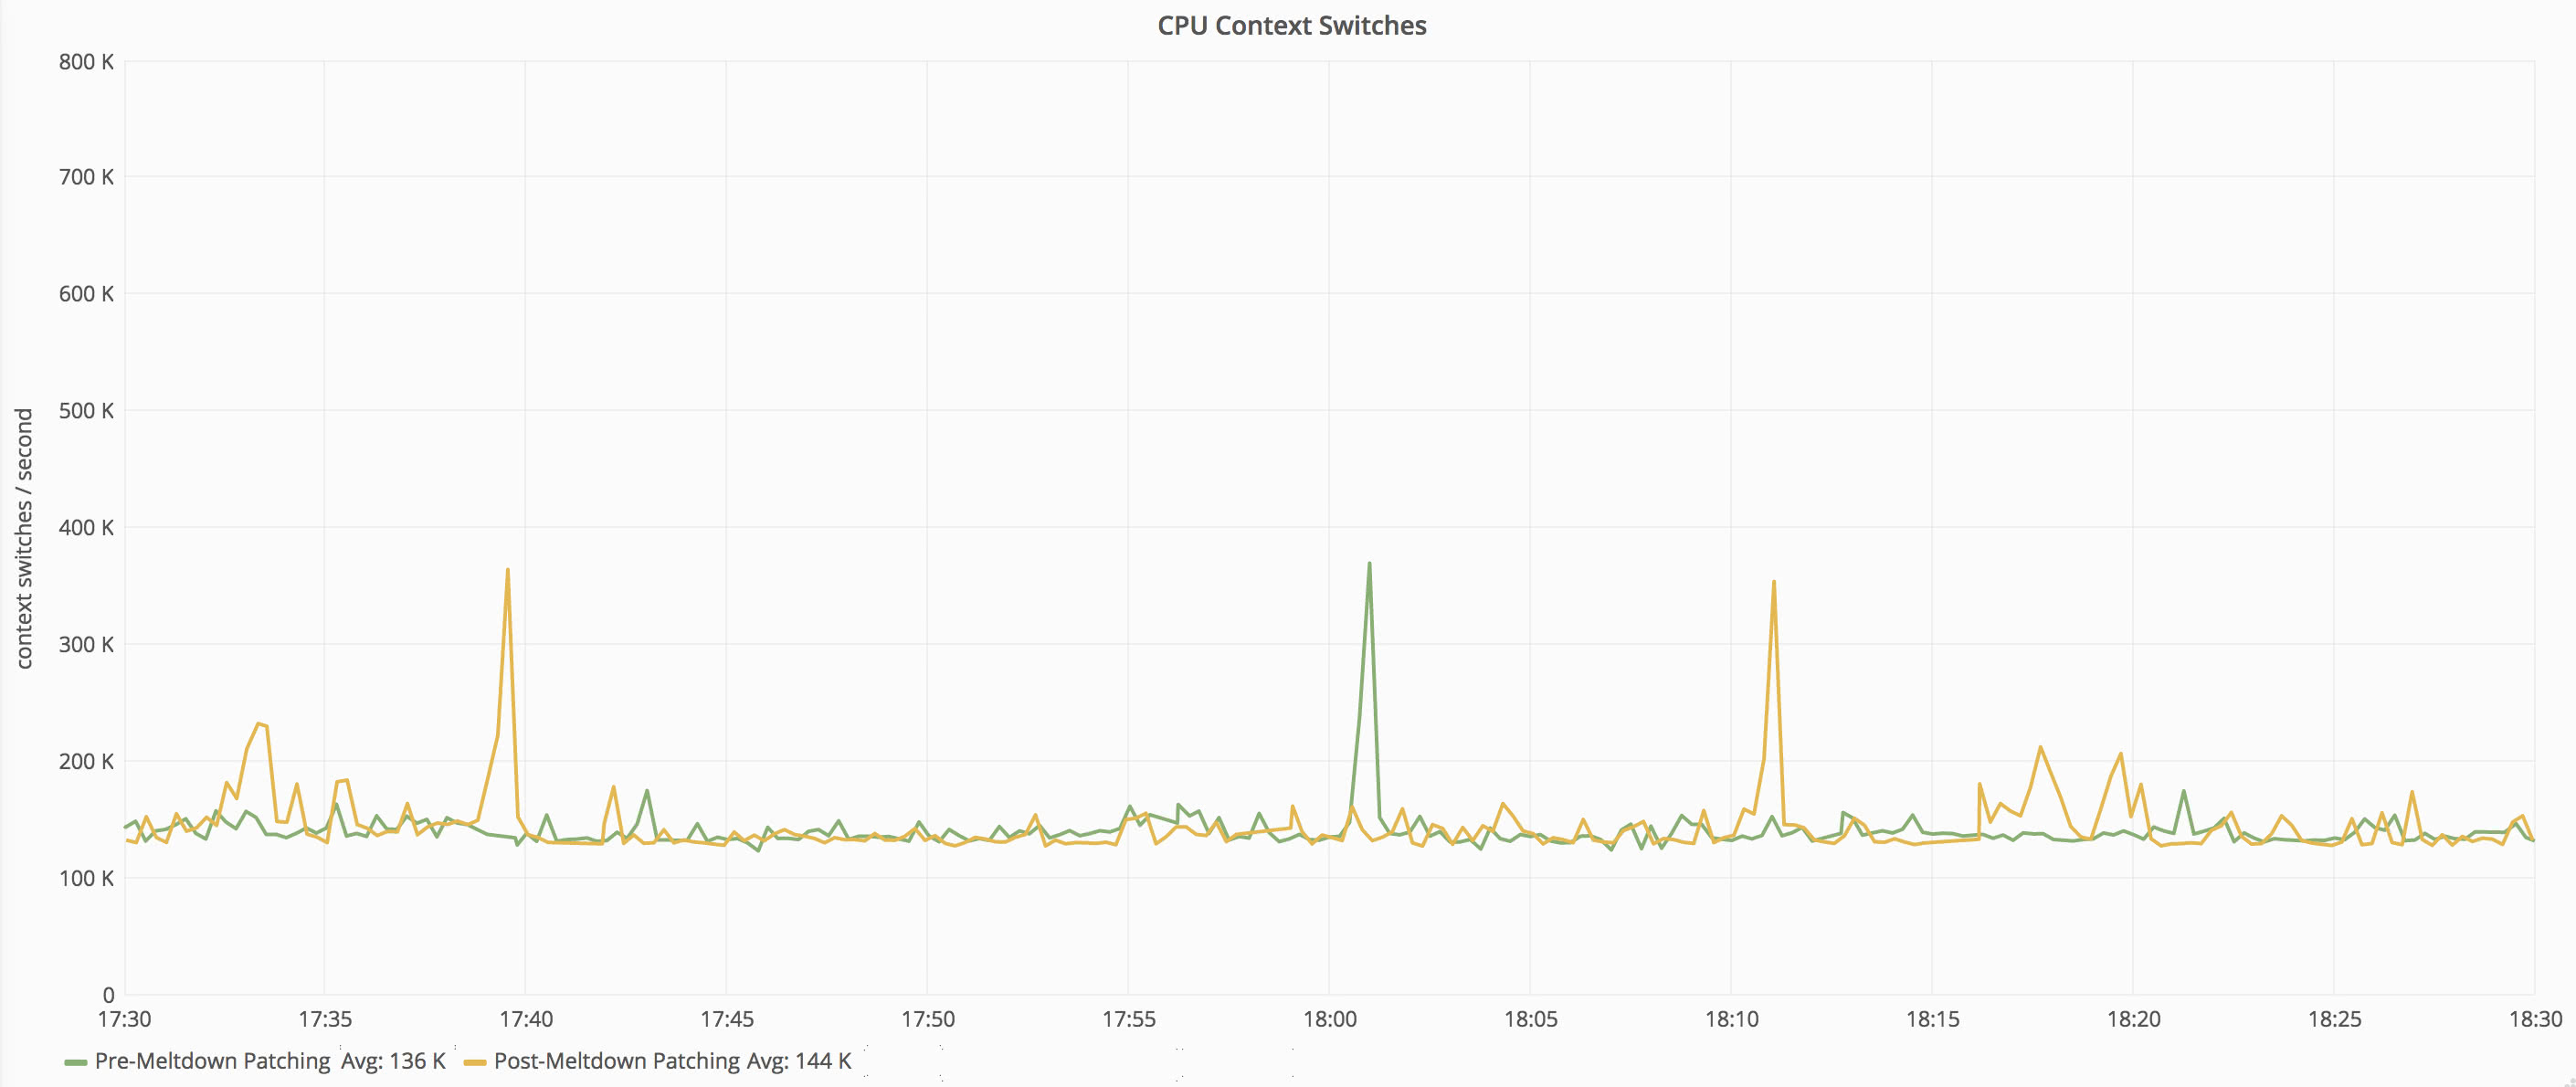
Context switch averages increased only slightly (about 6%). This makes sense because even after patching, the average CPU utilization of the server is still under 20%, and there’s lots of CPUs to do the work–each has 24 physical cores available (Dual E5-2690 v3 in each). With less overprovisioned machines, this number will be higher.
Let’s also take a look at some of the other metrics on the system.
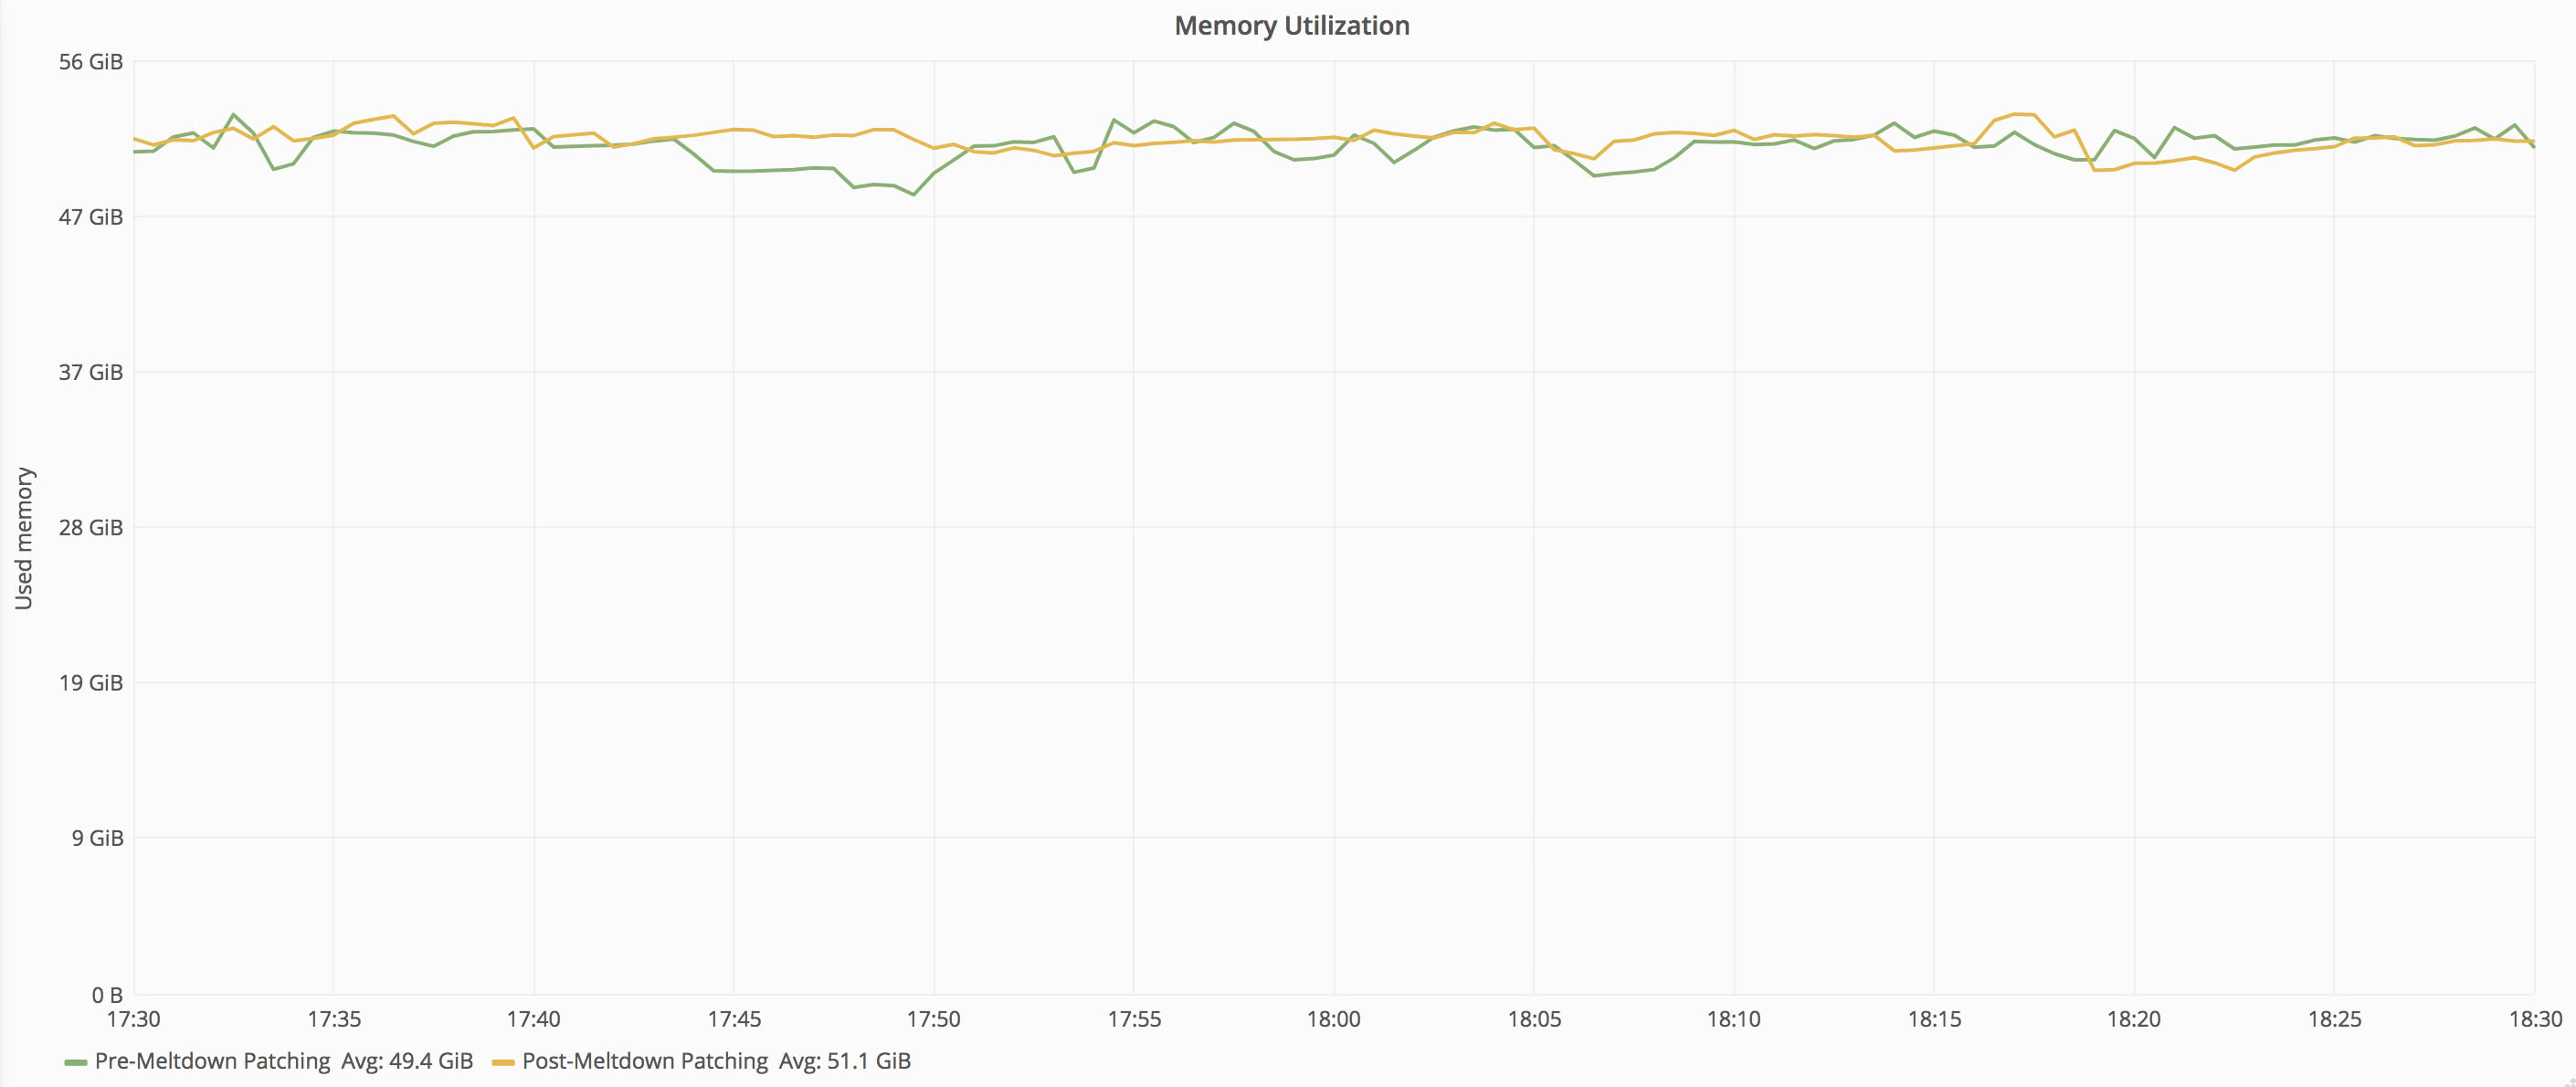
Memory usage holds even here, which makes sense as none of the server’s workload is changing.
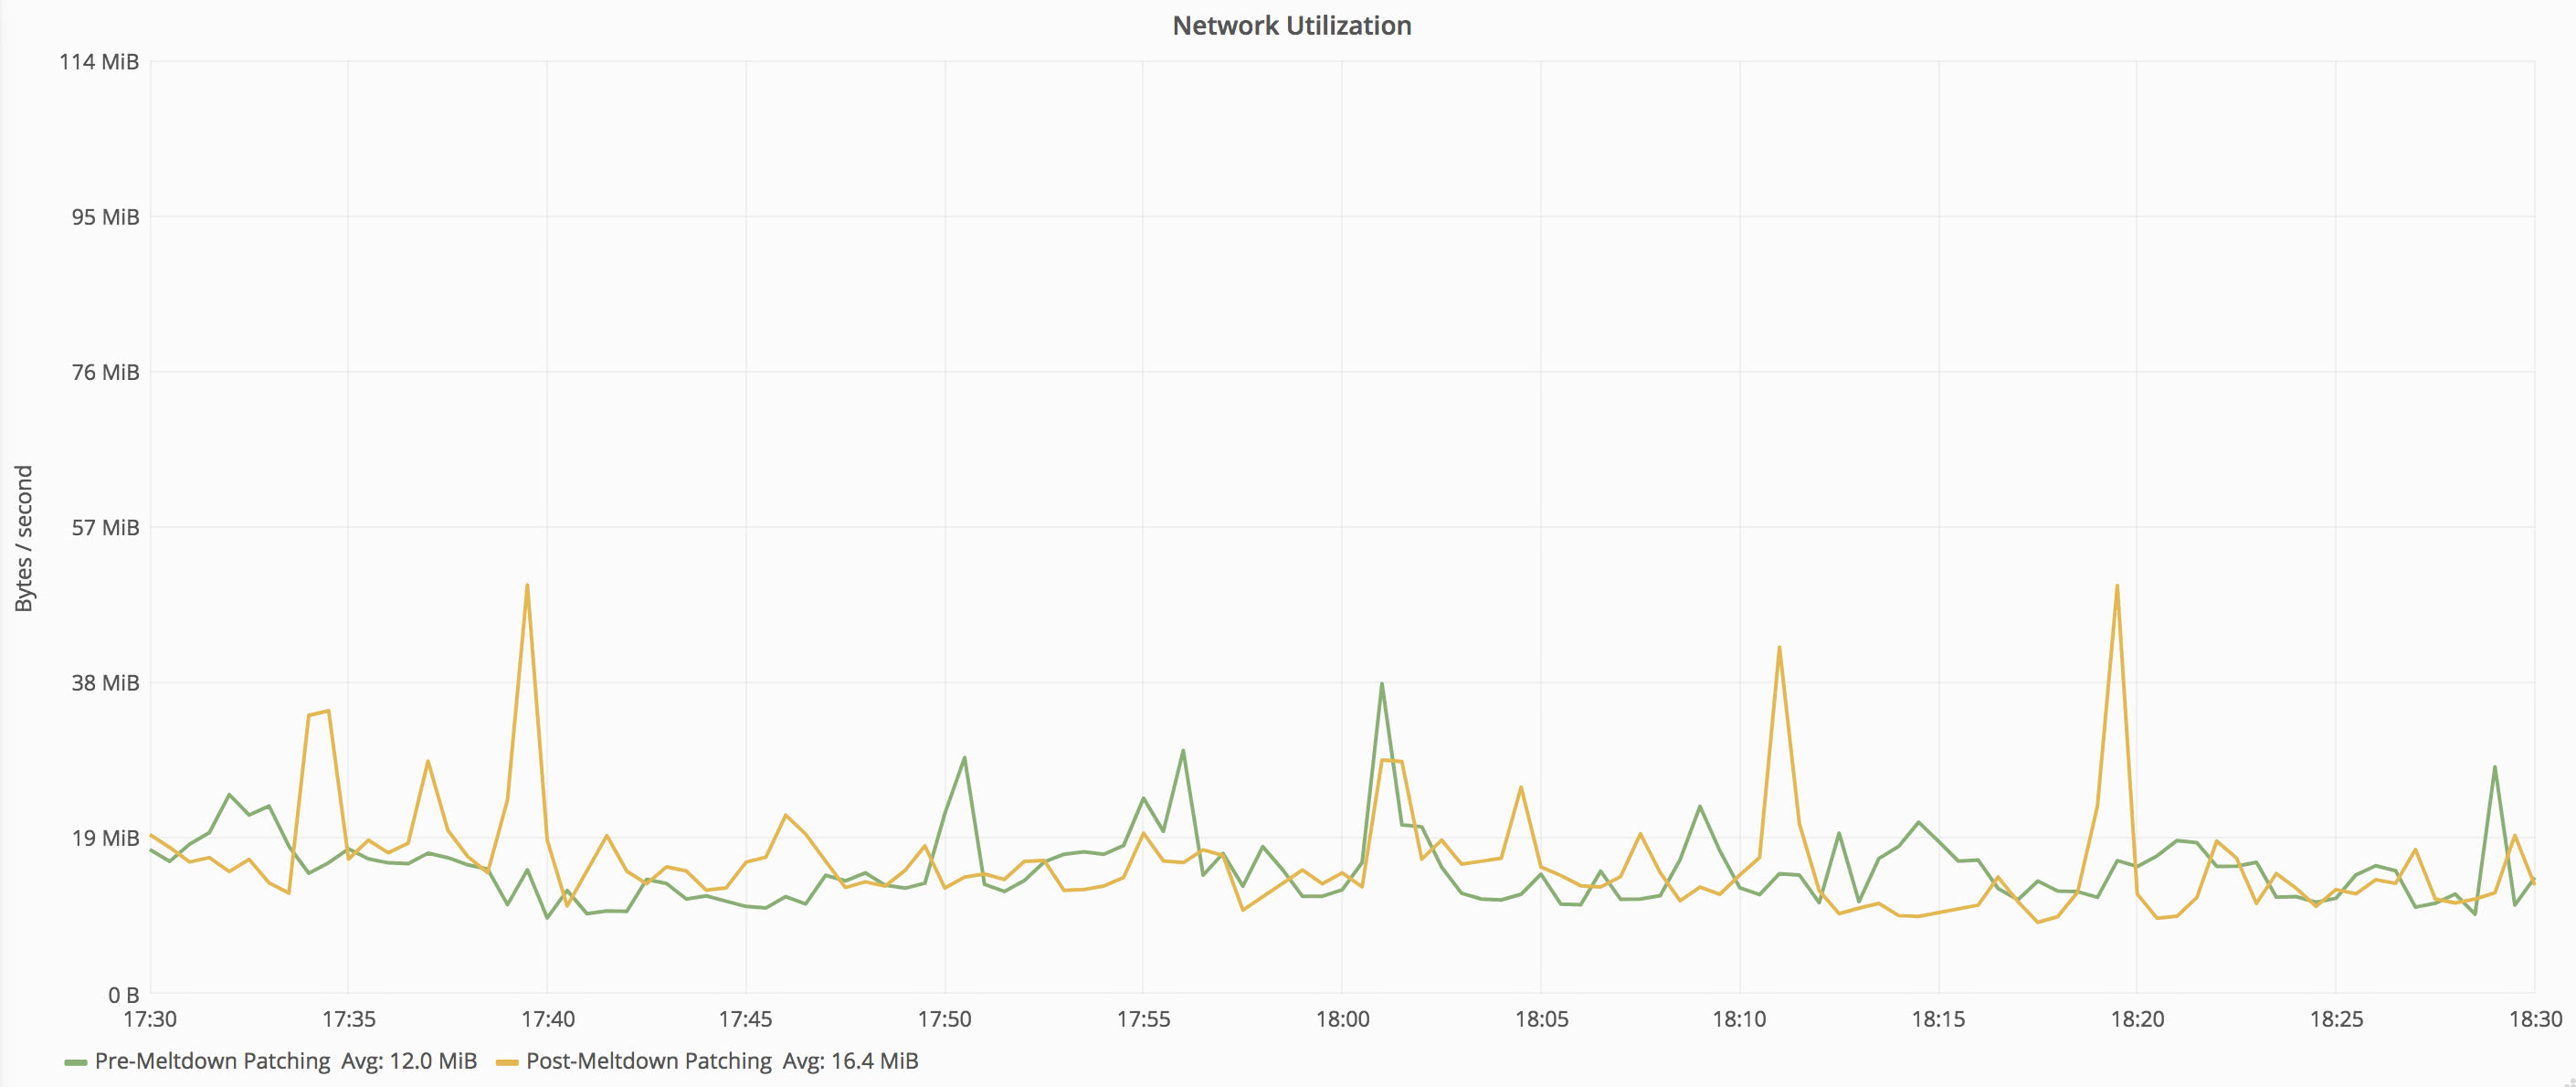
Network utilization is up slightly, but on a bonded 10 gigabit network, the traffic is less than 1% utilization.
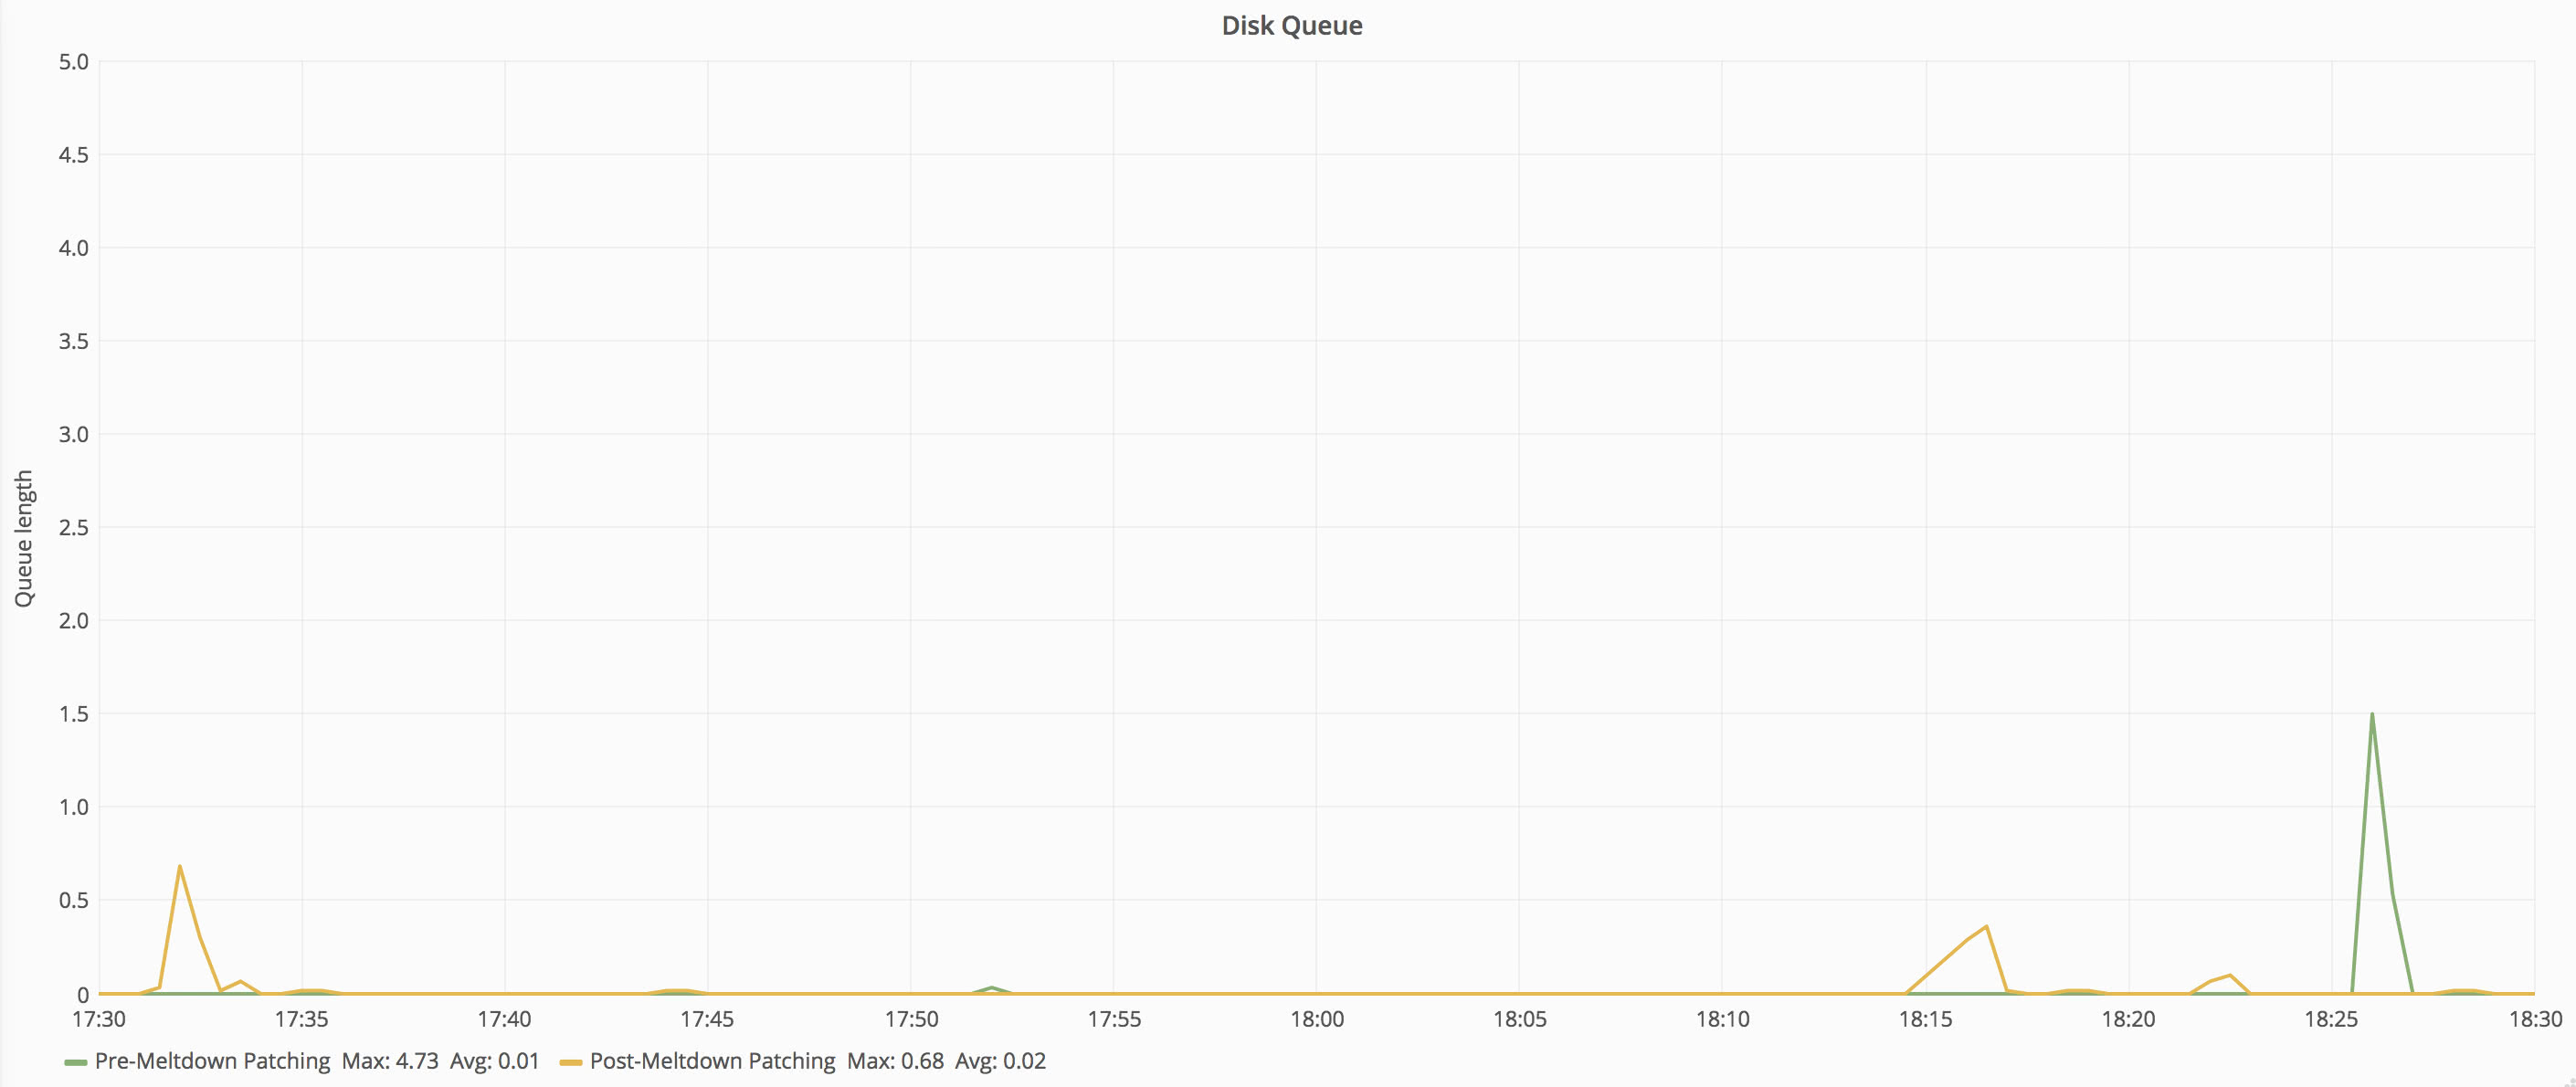
Server disks continue to see no pressure, and disk queue largely remains at zero.
Redis Server
This is a bare metal Centos 7 server running on Dell R630 (13th generation) rack-mount hardware.
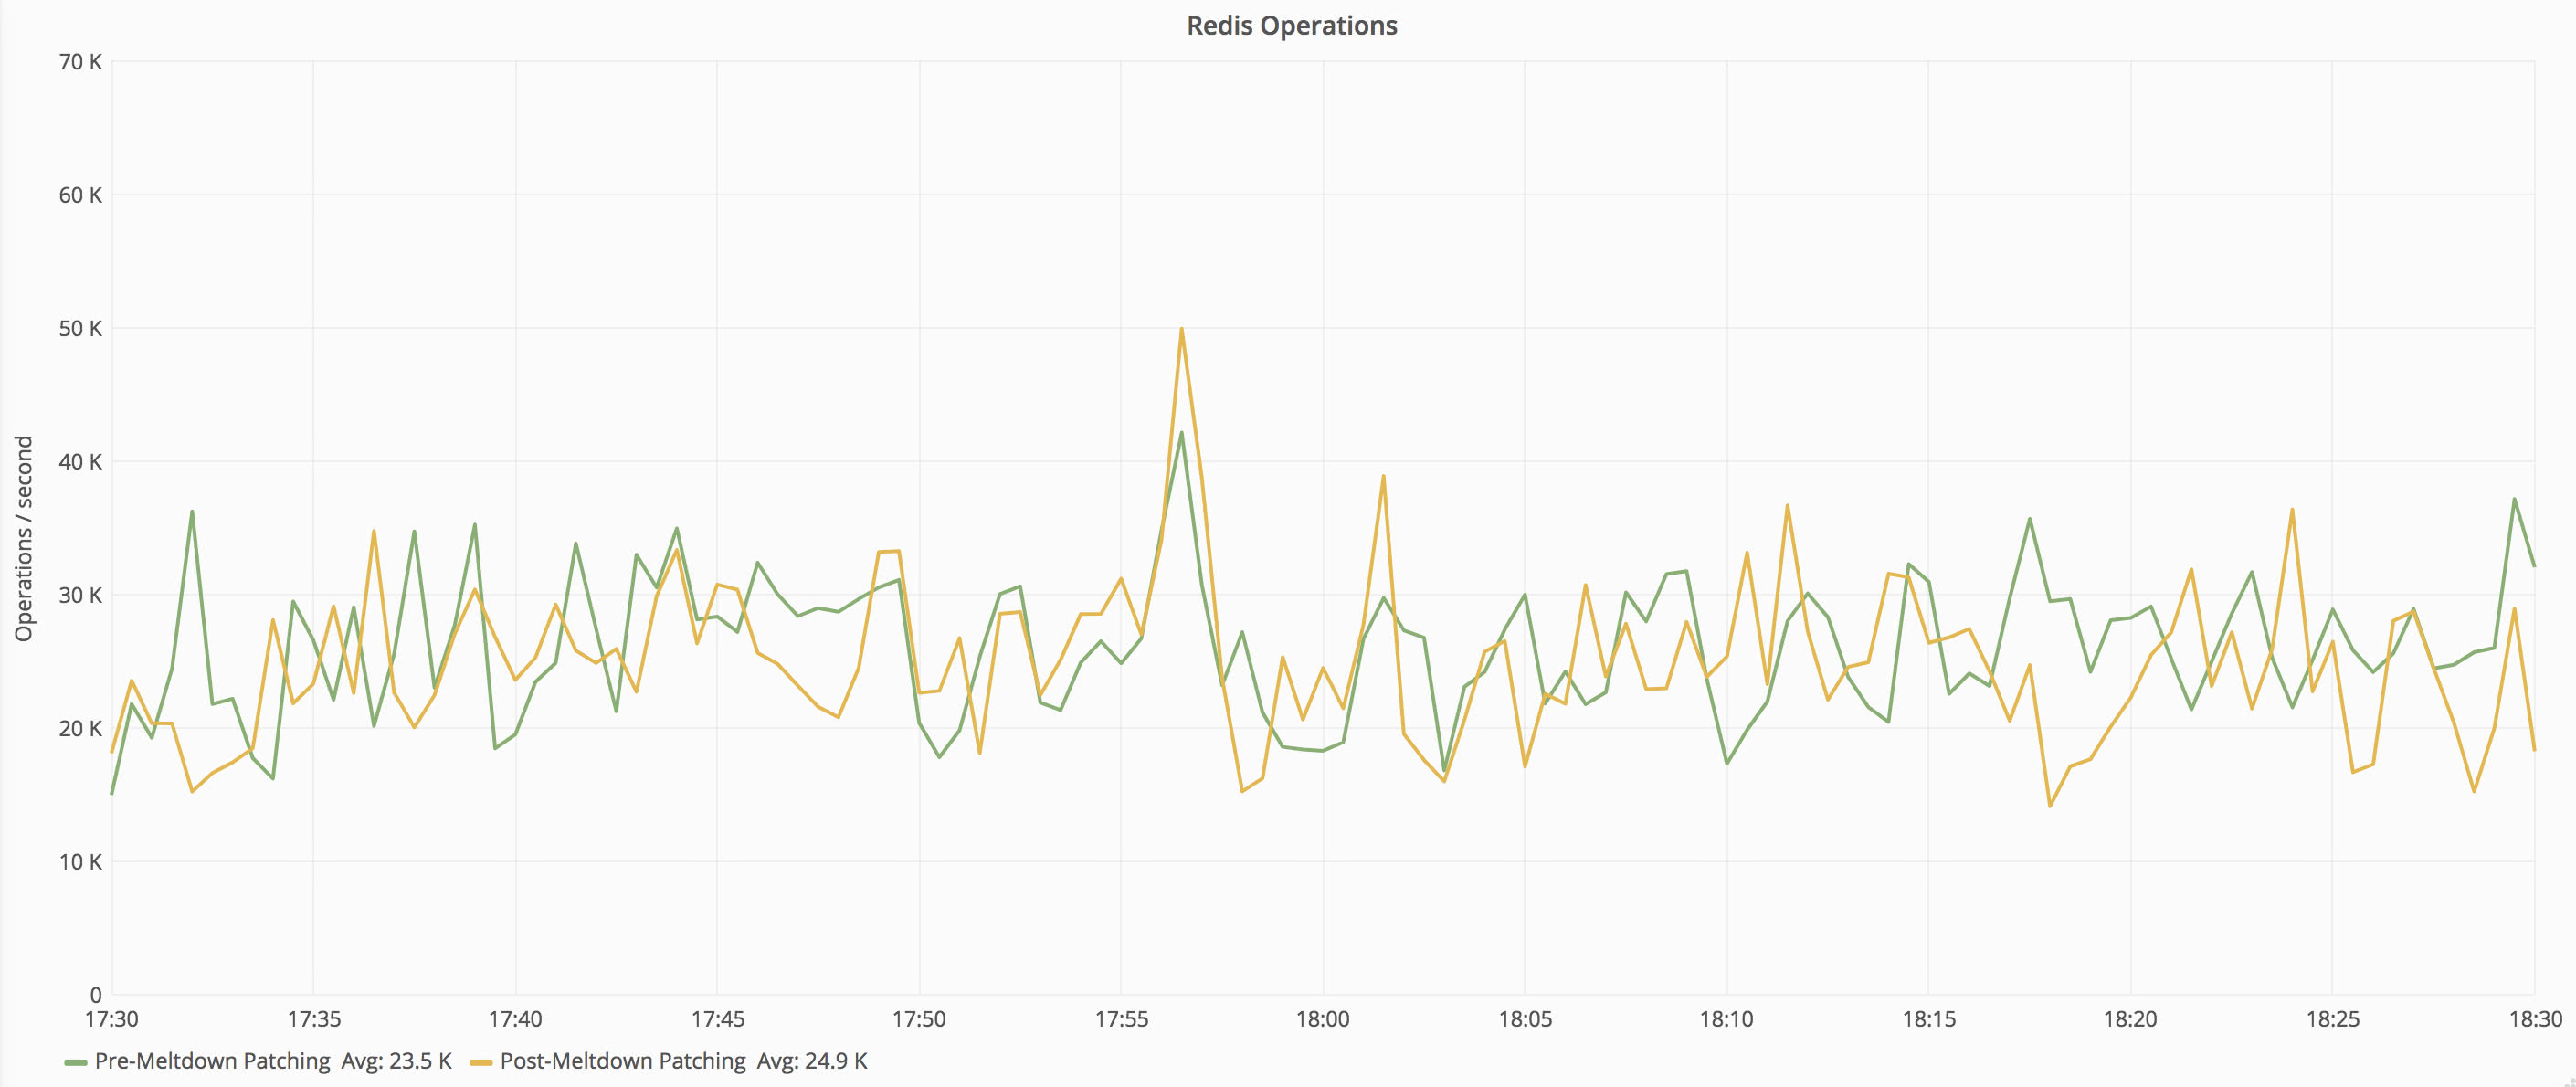
Once again, to ensure consistency when comparing the before and after data, we’ll take a look and make sure that the present workload on the patched instance matches the unpatched instance. For the redis servers, we’ll look at the number of operations per second, which are fairly consistent between calls.
Now that we’ve established that the workload is consistent between the two captures, we can compare CPU utilization between the two. Redis utilizes both memory and CPU to do its work, but it’s a very efficient process and doesn’t use many resources to handle large quantities of operations. After patching, the CPU utilization change is difficult to discern on the redis instance by looking at system metrics.
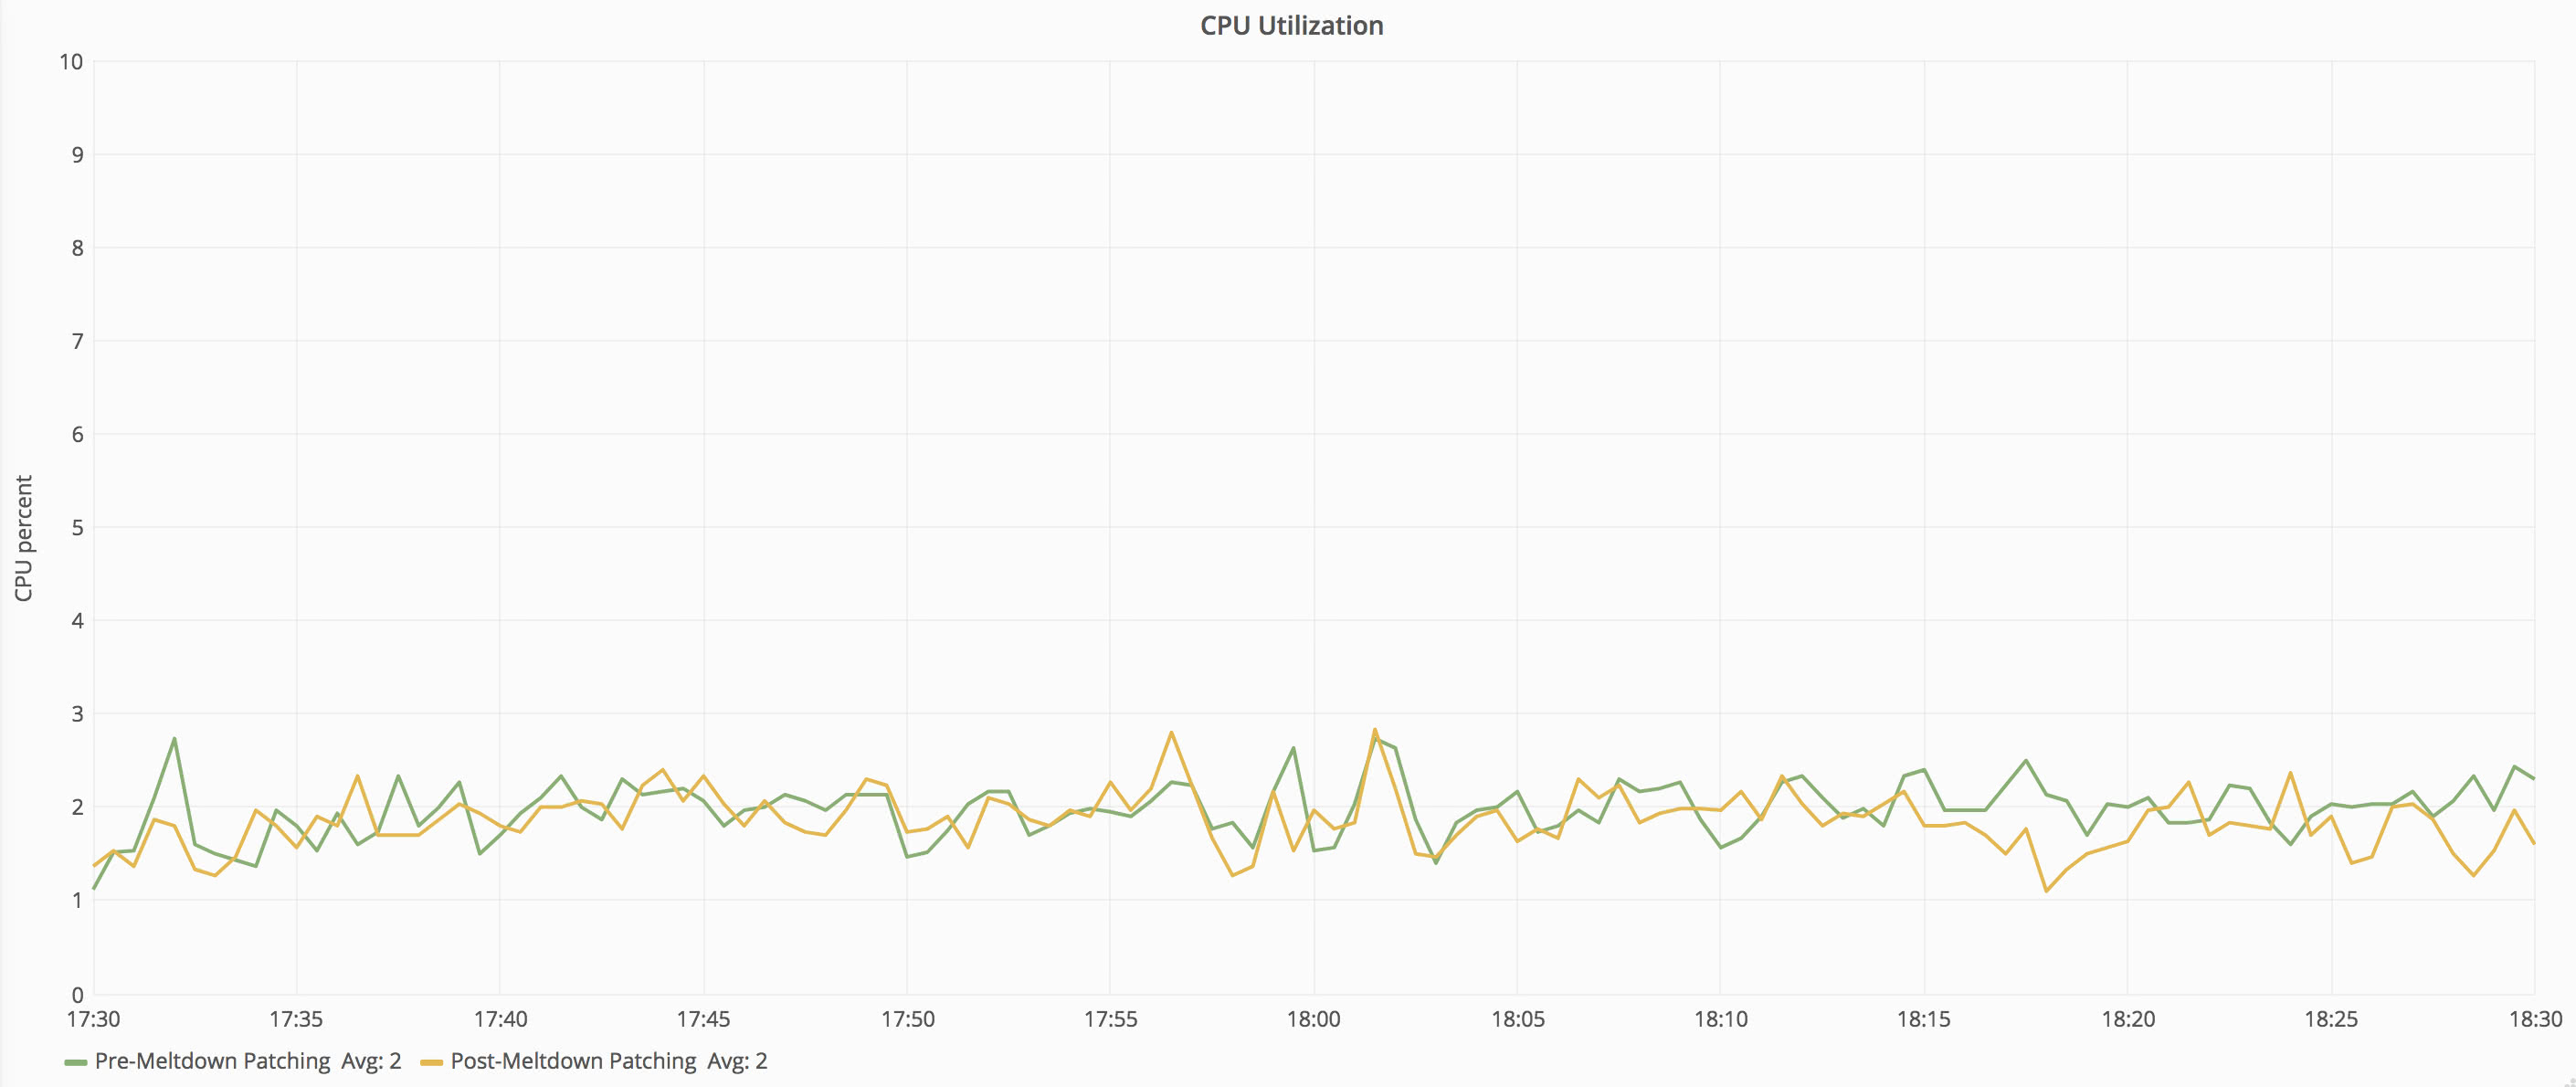
The CPU graph doesn’t tell the whole story though. Given the extremely low CPU load on the box, even a moderately high percentage jump in relative processor resource consumption is hard to see. What can be seen, however, is when testing synthetic workloads against the server–such as running redis’ internal benchmark tool. Doing so shows that the system is capable of 145k operations per second unpatched but reduces to about 95k operations when patched.
User Experience Impact
All of the timings below are based on server-side time to render, which eliminates network connectivity outside of our datacenter to get more accurate numbers.
As with above, the metrics from Jan 11, 2018 (post-patch) and Jan 10, 2018 (pre-patch) are taken from the same time of day (17:30UTC - 18:30UTC). Historical metrics are each from the same time of day on the second Thursday of the year to keep traffic patterns as close as possible.
Here’s what happened to our average load times after enabling mitigations.
Question view pages give us a good basis for comparison as each page has a very similar and consistent workload associated with it. For comparison purposes, I’ve also included averages from 2017 and 2016 for historical comparison.
SQL, Redis, HTTP, Tag Engine, and Elasticsearch times are all averaged across the number of requests made to each service. Each request could have zero or more calls to each service.
| Date | Time to Response | .Net Time | SQL Time | Redis Time |
|---|---|---|---|---|
| 2018 (patched) | 24ms | 17.99ms | 499us | 37us |
| 2018 | 19ms | 15.14ms | 403us | 28us |
| 2017 | 21ms | 14.73ms | 477us | 38us |
| 2016 | 19ms | 17.36ms | 621us | 42us |
Let’s pivot the table to compare the changes between pre- and post-patch times:
| Metric | Pre-Patch | Post-Patch | Percent Increase |
|---|---|---|---|
| Time to Response | 19ms | 24ms | 26% |
| .Net Time | 15.14ms | 17.99ms | 19% |
| SQL Time | 403us | 499us | 24% |
| Redis Time | 28us | 37us | 32% |
While these times have all increased, none have increased as sharply as the CPU utilization metric on each of the servers. The same pattern holds true for all web requests as seen in the table below:
| Date | Time to Response | .Net Time | SQL Time | Redis Time |
|---|---|---|---|---|
| 2018 (patched) | 20ms | 13.63ms | 830us | 49us |
| 2018 | 17ms | 12.29ms | 692us | 43us |
| Date | HTTP Call Time | Tag Engine Time | Elasticsearch Time |
|---|---|---|---|
| 2018 (patched) | 29.14ms | 5.71ms | 18.07ms |
| 2018 | 25.90ms | 4.46ms | 13.93ms |
Pivoting the table as above, we can see the overall patterns for each timing:
| Metric | Pre-Patch | Post-Patch | Percent Increase |
|---|---|---|---|
| Time to Response | 17ms | 20 ms | 18% |
| .Net Time | 12.29ms | 13.63ms | 11% |
| SQL Time | 692us | 830us | 20% |
| Redis Time | 43us | 49us | 14% |
| HTTP Call Time | 25.90ms | 29.14ms | 13% |
| Tag Engine Time | 4.46ms | 5.71ms | 28% |
| Elasticsearch Time | 13.93ms | 18.07ms | 30% |
While the percentages vary slightly between the two data sets, one thing that is consistent is that all metrics increased.
That said, averages only tell part of the story. Consider the following two sets of times to response: [100ms, 100ms, 100ms] and [20ms, 20ms, 260ms]. While both sets have the same average (100ms), they represent much different sets of data. In addition to averages, we need to keep track of what our least performant requests are doing. We’ll start with questions again:
| Date | Median | 75th Percentile | 95th Percentile | 99th Percentile | Worst .01% |
|---|---|---|---|---|---|
| 2018 (patched) | 17ms | 22ms | 45ms | 155ms | 2.256s |
| 2018 | 16ms | 20ms | 37ms | 87ms | 0.829s |
The median through 95th percentile bucket numbers are very much in line with the expections based on our findings above (about 26% increase in request time), but once we get to the longer requests at the 99th percentile and above, the durations increase exponentially.
Here’s all pages:
| Date | Median | 75th Percentile | 95th Percentile | 99th Percentile | Worst .01% |
|---|---|---|---|---|---|
| 2018 (patched) | 7ms | 17ms | 49ms | 180ms | 8.568s |
| 2018 | 8ms | 16ms | 41ms | 137ms | 6.922s |
When looking at all pages, all percentile tiers behave similar to the expected increases above.
Jumping back to the redis server referenced above again, we can see a slightly different impact. While the server took a huge hit in operation capacity (33% reduction–145k to 95k operations per second), there is enough overhead in the service that there is virtually no visible impact to end users. Response times from redis are largely unchanged, and the increases in time taken for redis service calls are caused by the application servers.
Recommendations
Because of the difficulty of exploitation at present and the extreme performance hits involved with implementing these mitigations, teams should carefully weigh whether accepting the performance hits of enabling the mitigations outweighs the risk of leaving the mitigations disabled. That said, performance impact varies greatly between systems and workloads, so testing the impact against your workloads is recommended.
On servers running trusted and patched software, enabling the mitigations may not be necessary. Microsoft recommends against enabling the mitigations on SQL Servers that are running on bare metal only trusted code. Microsoft has updated their recommendations and now recommends enabling patches for Meltdown but maintains that Spectre protections don’t need to be enabled if you’re running without untrusted code. Other performance-oriented software may also put out similar recommendations going forward.
Conclusion
One of the big takeaways here is that the increases in performance metrics didn’t linearly translate to longer waits for end users. That’s really good news. While it’s not ideal that we’re using significantly more CPU to render a user’s request, adding more compute power to our web tier is much easier than cutting down on elapsed time. Lots of performance tuning has already gone into our codebase, and we’re pushing the law of diminishing returns. On the other hand, adding more compute power involves sending Dell some money and racking up some additional servers.
It’s important to remember that system-level performance metrics won’t tell the whole story of impact of these mitigations. Service level metrics, such as page load times, database round trip times, or batch job completion times are much more effective at gauging impact of your systems. It’s not ideal if your flash storage throughput goes to half of what it previously was (i.e. 3 GB/s to 1.5 GB/s), but if you’re only sustaining 5 MB/s IO with spikes of 1000 MB/s, the impact will be negligible. Other changes, such as increased request processing time, can have unexpected consequences. If requests take longer and volume holds with previous levels, the number of overlapping simultaneous requests increases, which can strain shared resources (such as connection pools to a common back-end service). Increased CPU utilization also has a direct impact on power consumption; when running your own infrastructure whether colocated or in-house, power constraints may suddenly become a big issue. As always, make sure to monitor your metrics as you move forward.
Related Links

Mike Newswanger
Sr Software Engineer at Elastic; previously SRE at Stack Overflow — go, performance, kubernetes, containers, databases